by Xavier Bailleau | Feb 21, 2018 | Model & Remote Sensing
Sentinel 2 images often contain some clouds, with mathematical processing it is possible to correct cirrus effect, but it is impossible to see through thick clouds. The objective is to detect them to avoid inaccurate results. Logically one should be able to detect the...
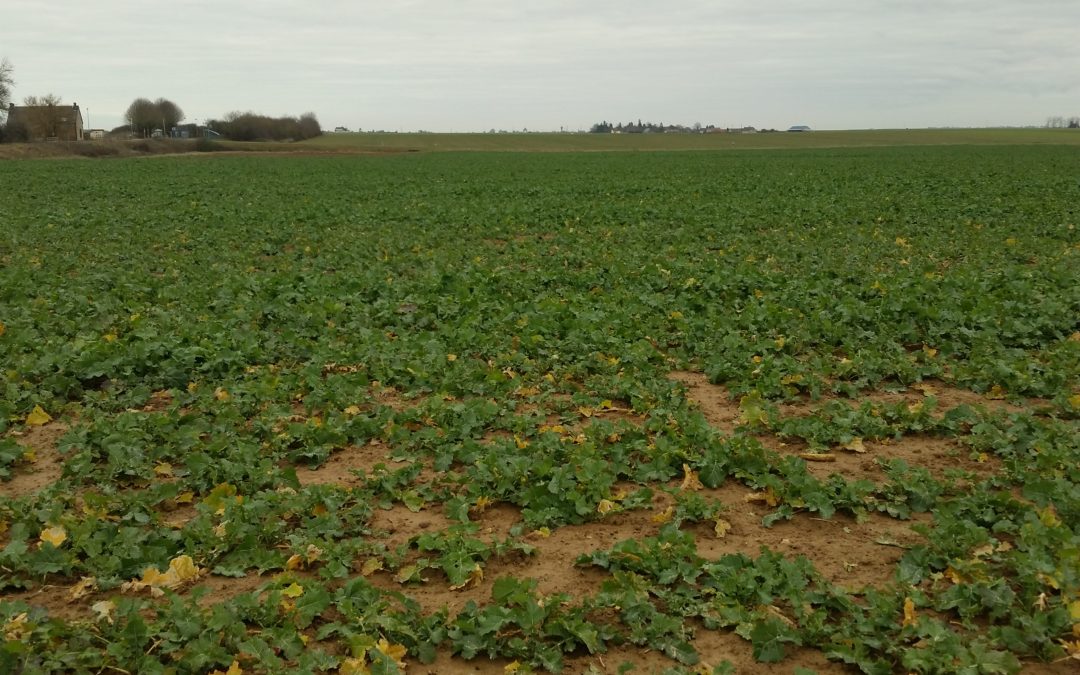
by Xavier Bailleau | Feb 12, 2018 | In The Field
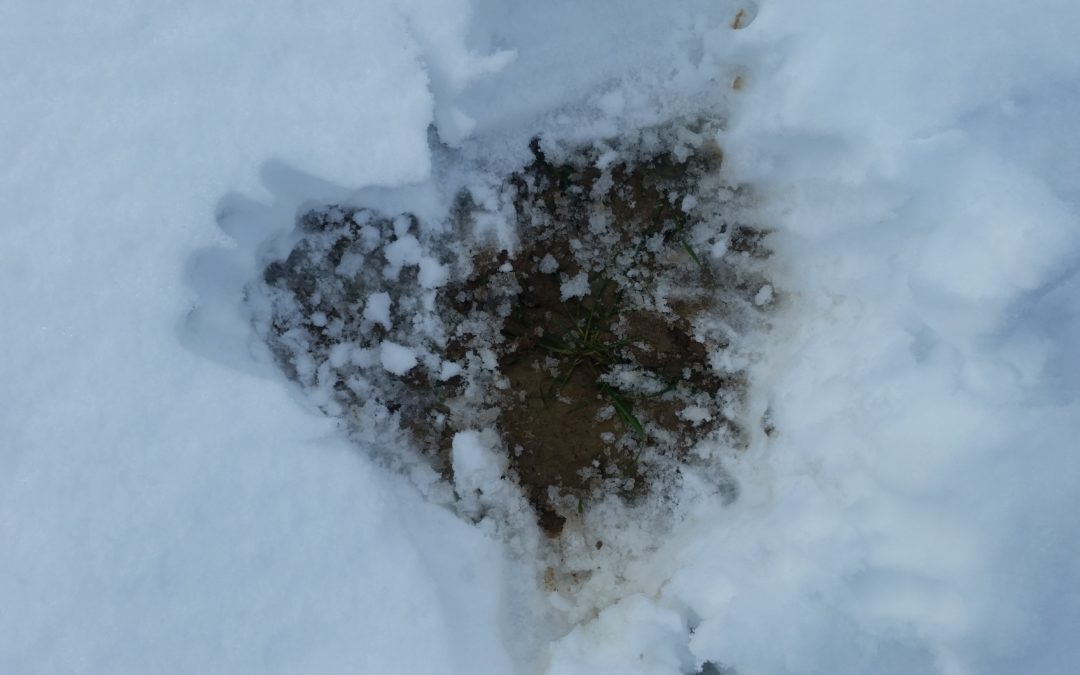
From the begining of the wheat growing season, the temperatures are above normal climatic data in Eure et loir (Paris Basin), wheat crop did not achieved its cold acclimation when very low temperatures occured last week. Old farmers remember of the 1956 winter...
by Xavier Bailleau | Jan 23, 2018 | Commodities financial analysis
Each month USDA publishes the WASDE report which gives projections about commodities demand and supply. All the commodities traders have their own “robot software” to check as soon as published the trend of USDA report. One of the major data watched is the...
by Xavier Bailleau | Jan 9, 2018 | Model & Remote Sensing
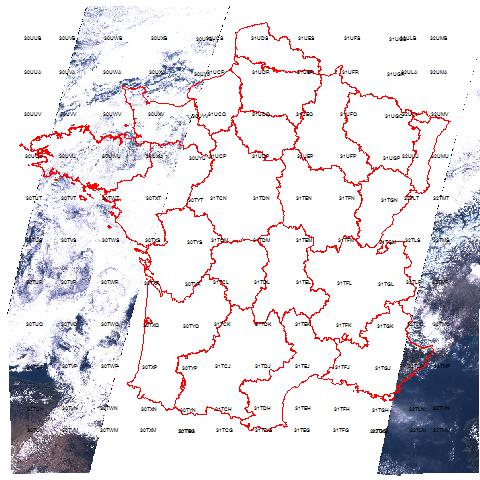
The satellite images user is mainly interested about cloud cover because it is one the major problem to deal with. I wrote a very small and simple program to analyse all the images from Sentinel 2A over France during 2016. It took around 15 hours to check all the...
by Xavier Bailleau | Jan 5, 2018 | Model & Remote Sensing
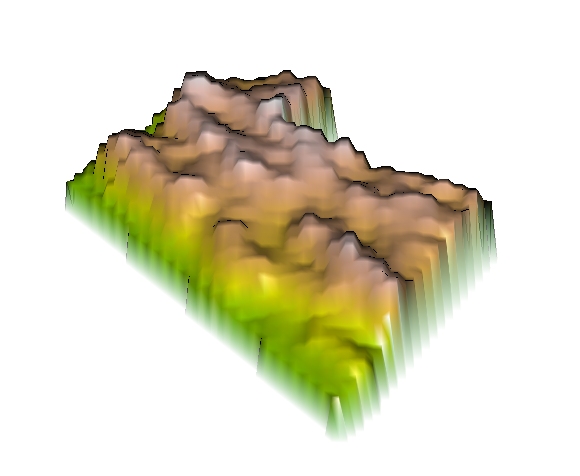
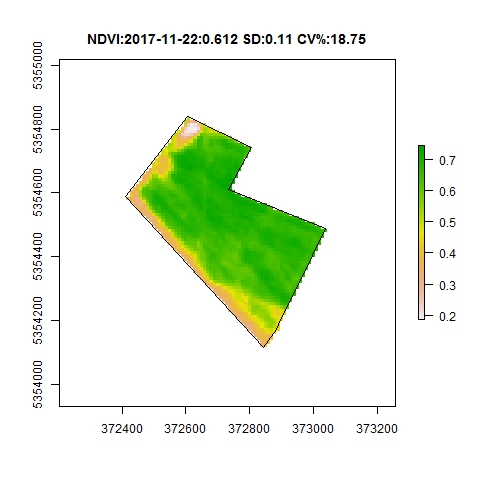
Most of the time, vegetation intra field variability is due to soil heterogeneity, in some cases, it can be due to different agricultural practices or tillage time. This is the case in that rapeseed field, sown on two different dates, as explained in a previous post....
by Xavier Bailleau | Jan 4, 2018 | Model & Remote Sensing
Vegetation indices are formulas to transform remote sensing wavelength bands to enhance vegetation properties (Leaf area index, biomass, chlorophyll content, water content). The advantage of these indices is that they are very easy to use and very low computer time...
by Xavier Bailleau | Jan 4, 2018 | Model & Remote Sensing, Non classé
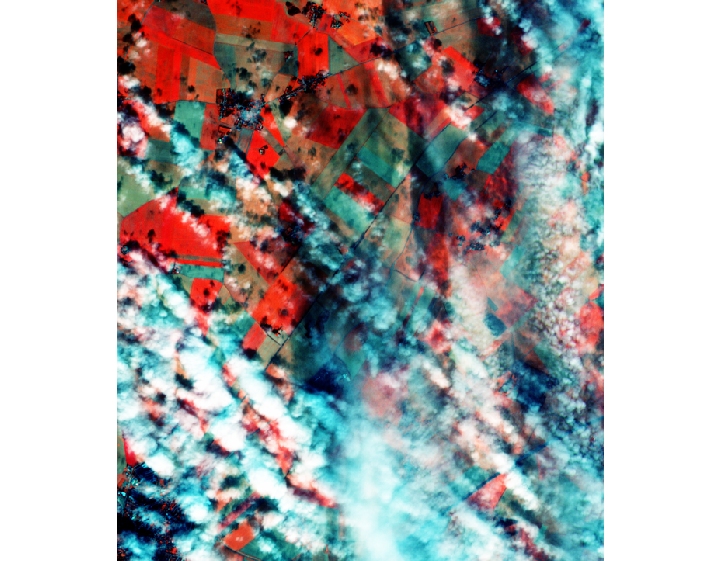
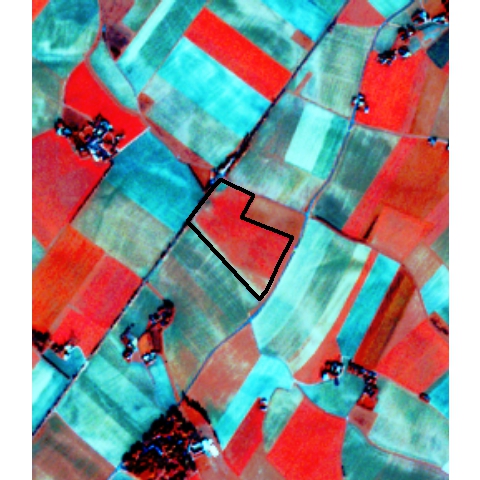
Satfarming provide color composite images to highlight specific crop components. The simplest way to proceed is to replace usual Red, Green and blue components by another wavelength bands combination. Above image grid: Examples of different combination bands as RGB...
by Xavier Bailleau | Dec 20, 2017 | Model & Remote Sensing
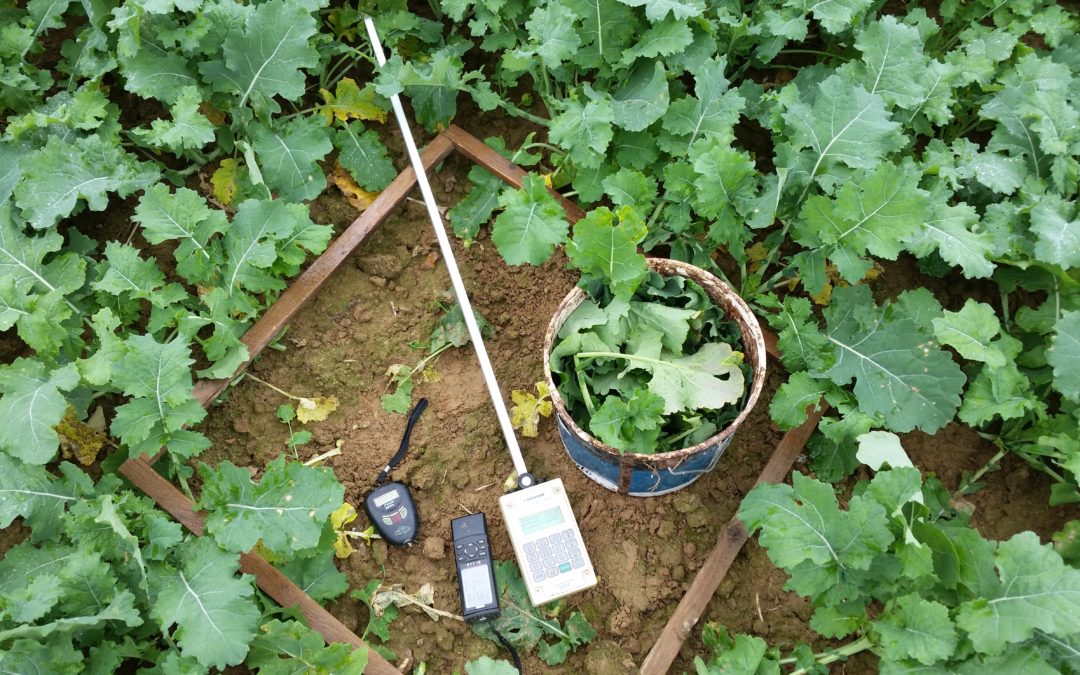
Material: Sentinel 2A image: 2017/12/12 Method: Compare Image IT YARA and manual weighting rapeseed biomass Objective: Demonstrate that both technologies are complementary On 2017/12/12 Sentinel 2A produced a clear image above France. It was the occasion to compare...
by Xavier Bailleau | Dec 18, 2017 | In The Field, Non classé
Material: Sentinel 2 image (ESA) Methods: Artificial Neural Network to convert reflectance to biophysical variables Objectives: Estimate fresh aerial biomass and nitrogen uptake to calibrate nitrogen balance sheet method Satfarming embed artificial neural...