
Vegetation indices are formulas to transform remote sensing wavelength bands to enhance vegetation properties (Leaf area index, biomass, chlorophyll content, water content).
The advantage of these indices is that they are very easy to use and very low computer time consumming.
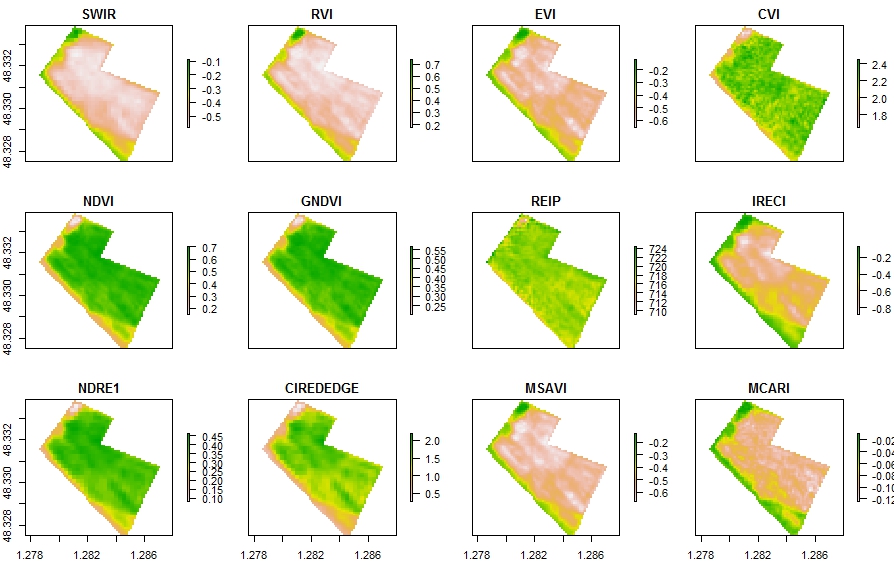
12 Vegetation indices on a rapeseed crop field from S2A 12/12/2017
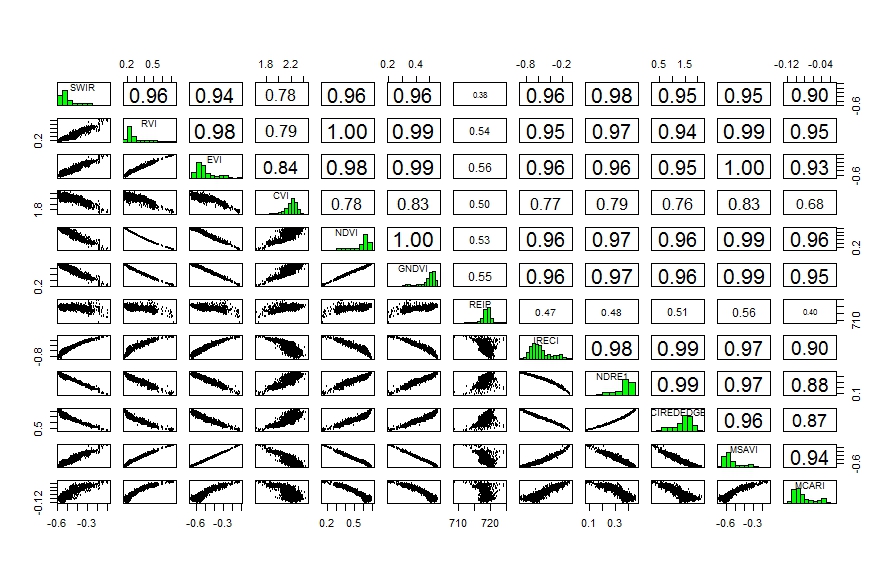
Correlation matrix between the vegetation indices
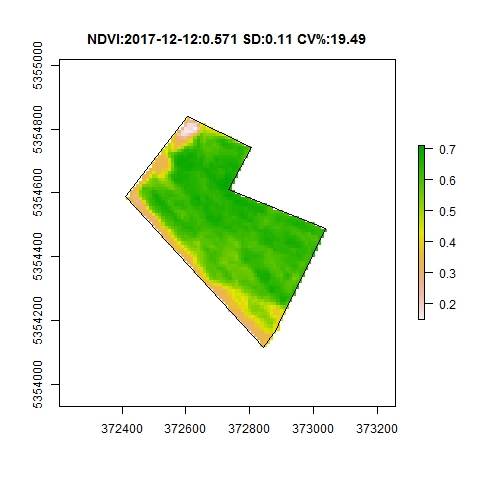
Vegetation indices are well suited for intra field variability analysis, a statistical analysis can be done on a two dimensions raster matrix. The mean and standard deviation are good statistical indicators.
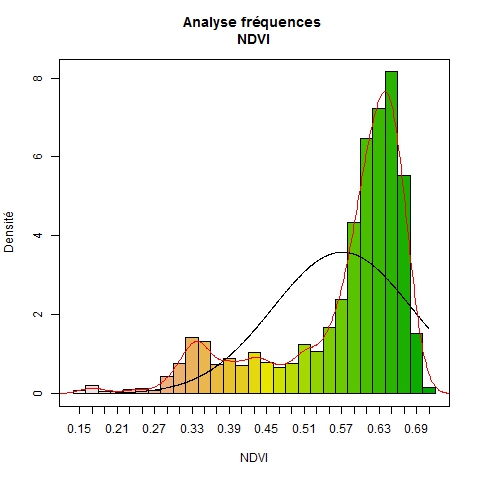
Frequential analysis
On this graph, by comparing the black curve (normal distribution of the pixel according to the mean and the standard deviation), and the red curve (smoothed field pixels distribution), one can note that there is a typical area of interest on the first red curve mode, probaby with a vegetation problem. In that field, indeed, the emergence rate was very low due to crust due to rain just after the sowing.
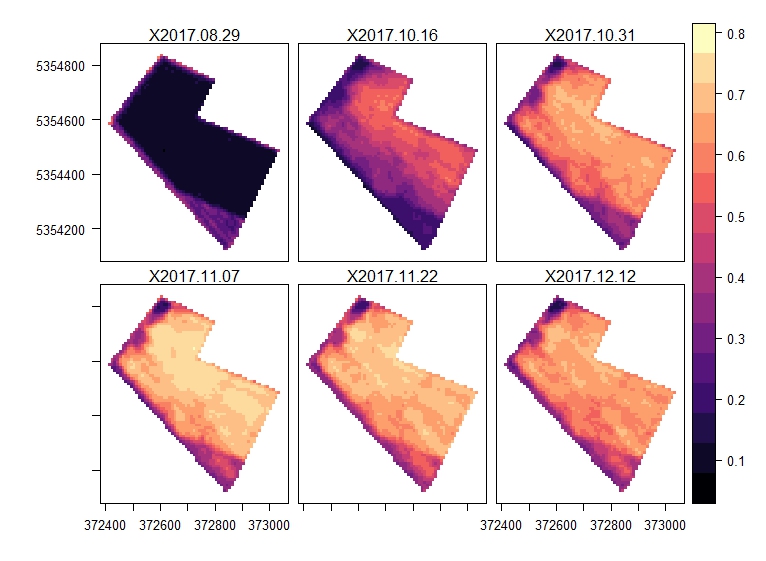
NDVI from the sowing date