- Material: Sentinel 2A image: 2017/12/12
- Method: Compare Image IT YARA and manual weighting rapeseed biomass
- Objective: Demonstrate that both technologies are complementary
On 2017/12/12 Sentinel 2A produced a clear image above France.
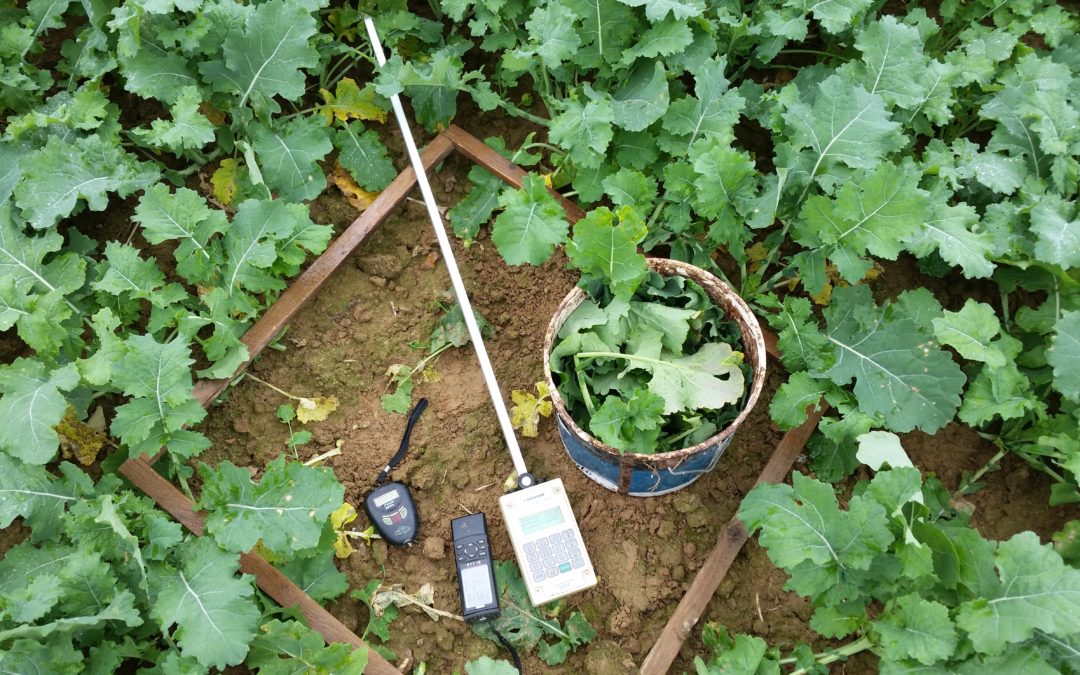
It was the occasion to compare remote sensed biomass and observed biomass. The task is quite difficult according to the recording area (100 m2 for Sentinel and 1/2 m2 for ground measurments)
The manual weighting was compared with Yara image IT application (smartphone digital photos analysis) which accuracy is widely proven.
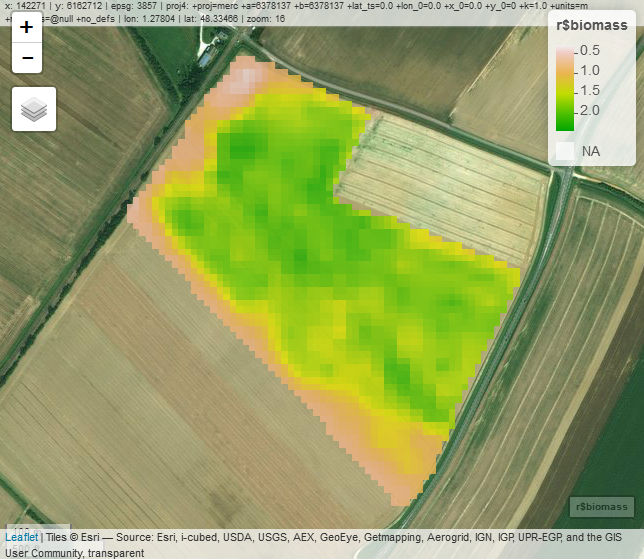
2 D dimension of a 20ha rapeseed crop sown on August 2017 25th
3D plot of the field
The 3D plot highlight some “lines” in the field due to irregular nitrogen residual from the preceeding crop (winter wheat)
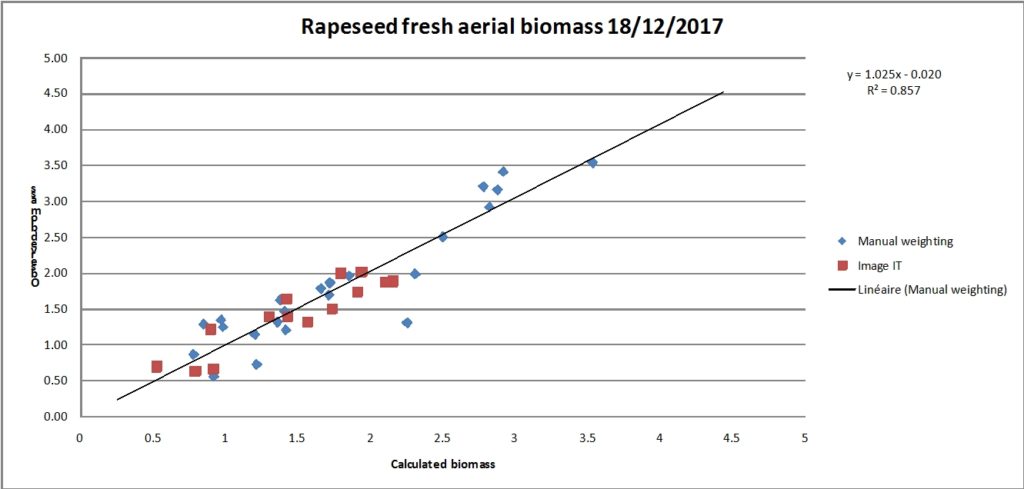
Above graph: Regression between calculated biomass from ground leaf area index measurments (horizontal axis) and observed biomass (vertical axis) for manual weighting and image IT estimations.
There is an evidence that image IT is a very good rapeseed biomass estimation tool and that fresh aerial biomass is correlated to leaf area index. Other measurments will be planed in field with higher biomass level at the end of the winter.
Image IT produce good biomass estimations but take into account only small plots in the field, the user has to target average field’s representative plots . The satellite images (cloud free) watch the entire field and yield a global estimation, on my point of vue, both systems are complementary.
Further investigation will be necessary to take into account canopy chlorophyll content to estimate crop nitrogen uptake to increase efficiency.