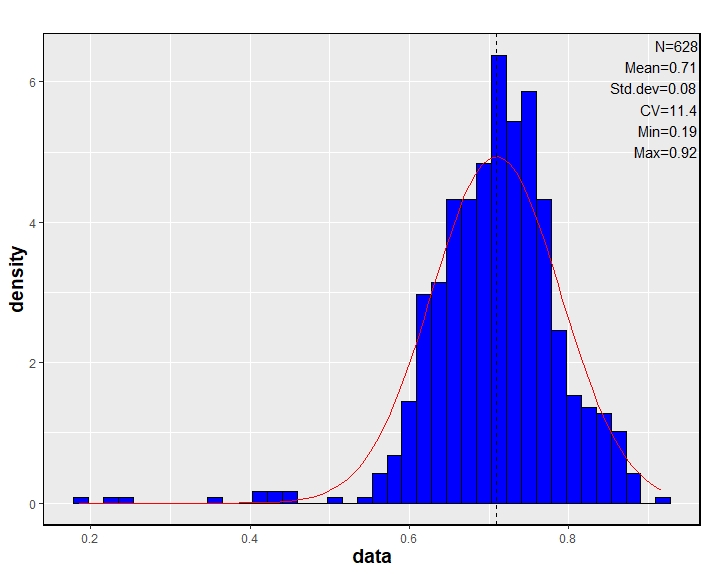
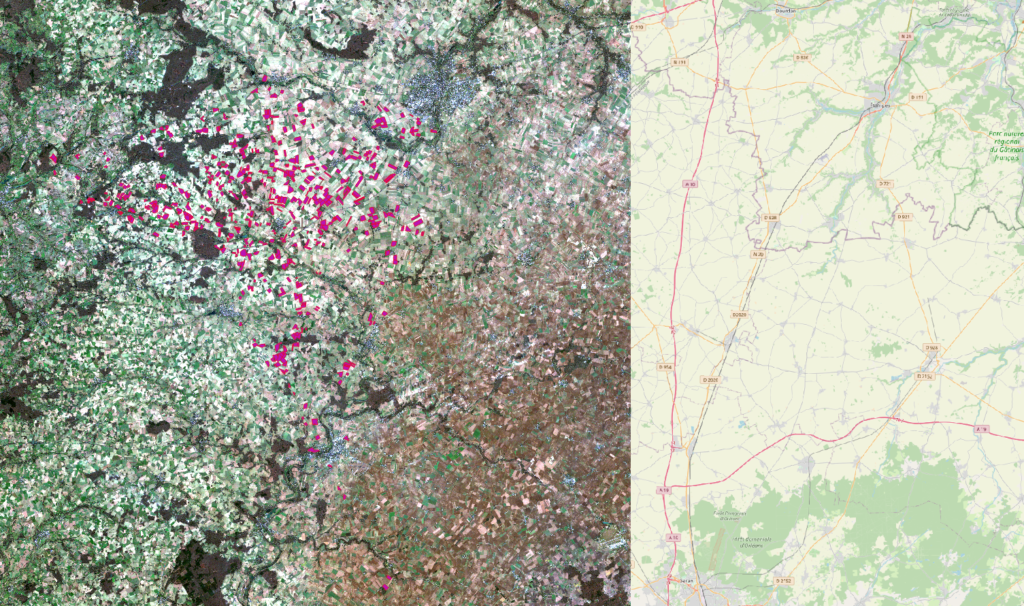
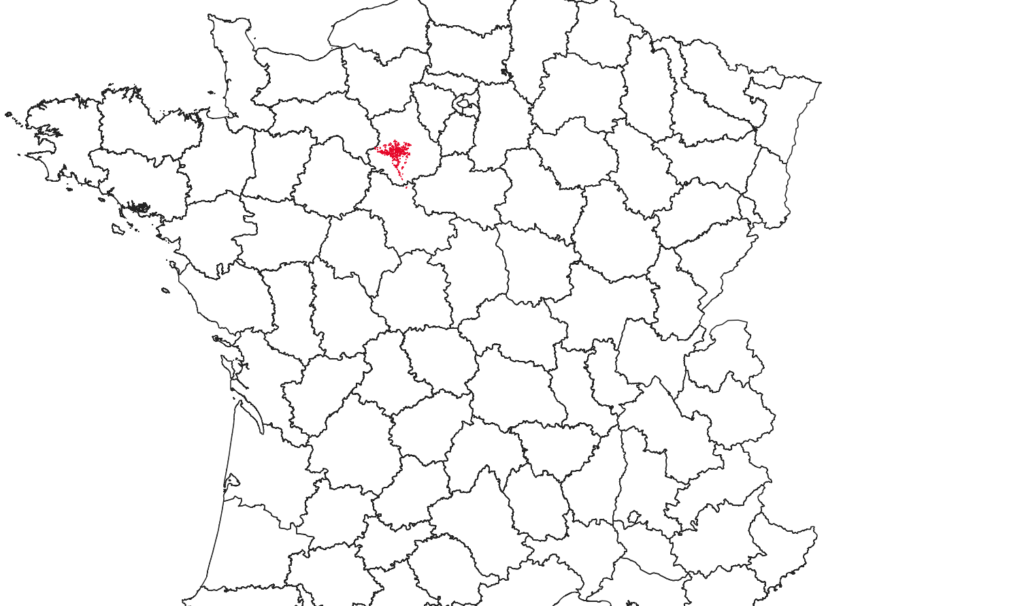
Study was conducted on a panel of 628 fields (7099 ha, around 7% of total oilseedrape area in Eure et Loir), all Sentinel 2 images are stored and analysed by a R program on a 24 threads computer running in parallel mode.
Images over each field containing clouds are discarded, this element is very important and quite difficult to process correctly, some weights are taken into account for each cloudmask classe to discard only the true bad image parcels.
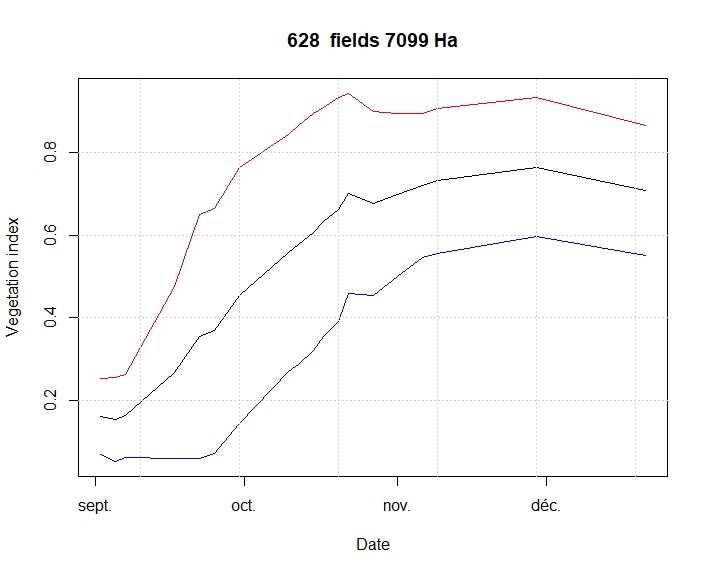
Figure 3 indicate the time serie for NDVI:
Normalised Difference Vegetation Index
\(\textrm{NDVI}=\frac{\mathrm{NIR} – \mathrm{Red}}{\mathrm{NIR} + \mathrm{Red}} \)
where NIR=B08 (834 nm) and RED=B04 (665 nm)
The black curve is the mean (628 fields), for each field, all the containing pixels are taken into account, the field mean is returned for each date, thus 709 922 pixels were analysed for all 19 images. To generate this graph (figure 3) 13 488 518 pixels were analysed, the process took 40 minutes on the computer. Red and blue curve represent the mean plus or minus 2 standard deviation value as in normal distribution, indicating upper and lower values for the panel.
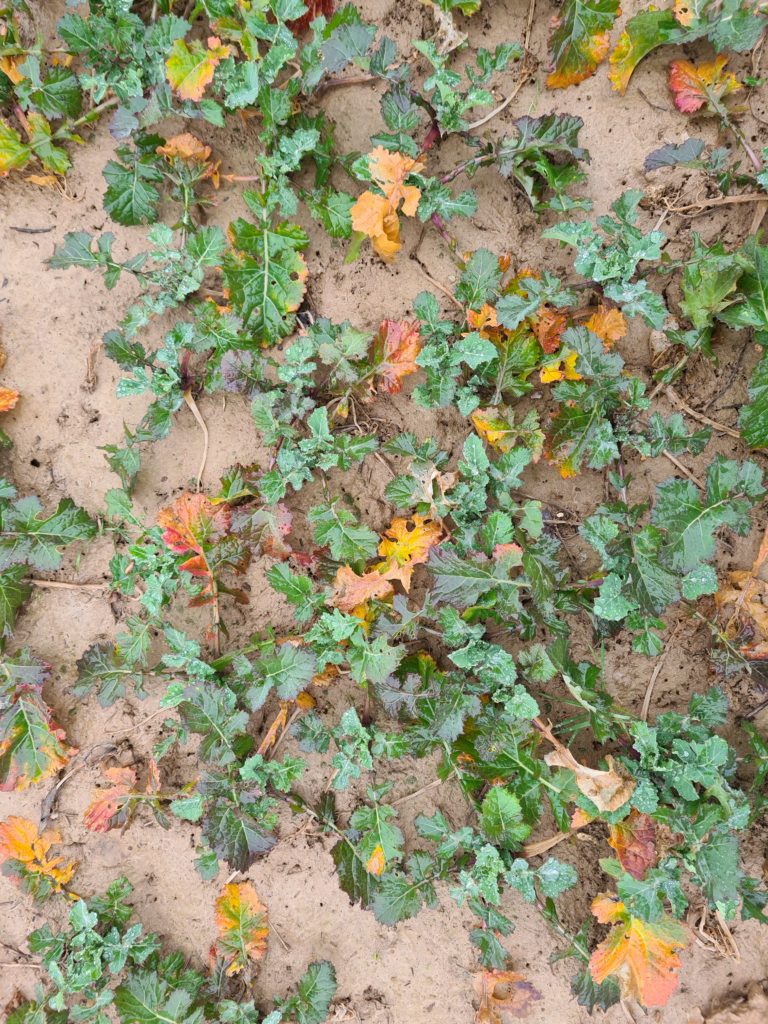
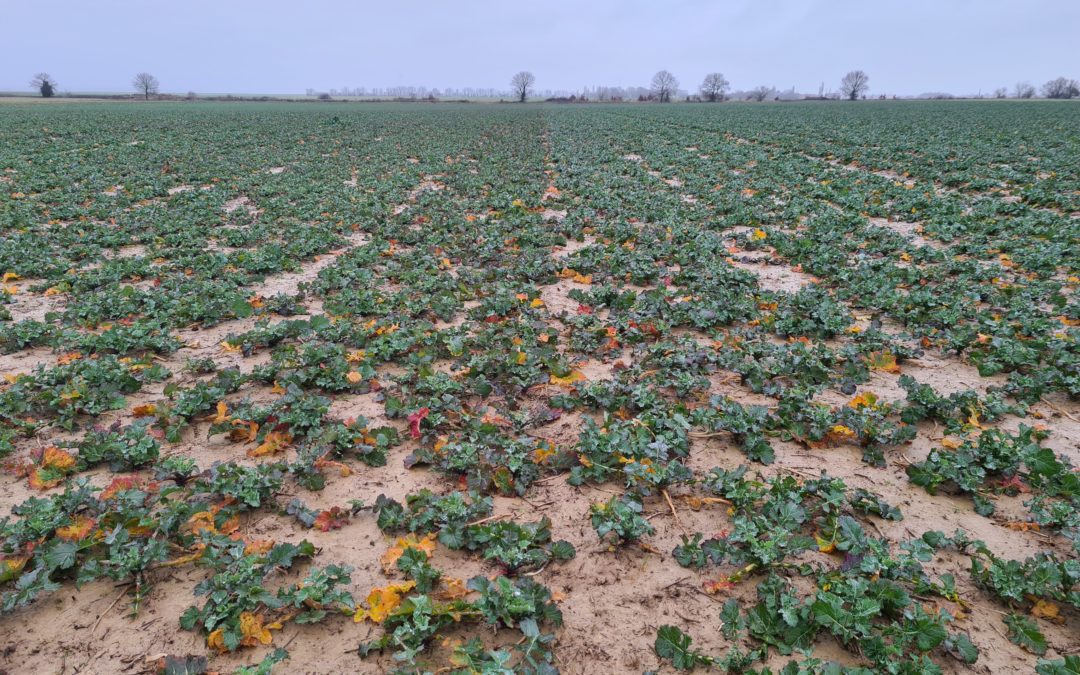
Plants are now in winter senescence phase due to soil nitrogen lack, leaves are coloring to yellow and red, aerial fresh biomass is slowly decreasing, this phase is considered as dormant phase, vernalization process is continuing with low temperature, or eventually devernalization may occur during warm temperature phases like end of december 2021 !
On the graph (figure 3), the nitrogen lack starts on the begining of december.