INTRODUCTION
Weather data are the most important component in crop growth and development, usually in crop modelling we use daily weather data from weather stations records.
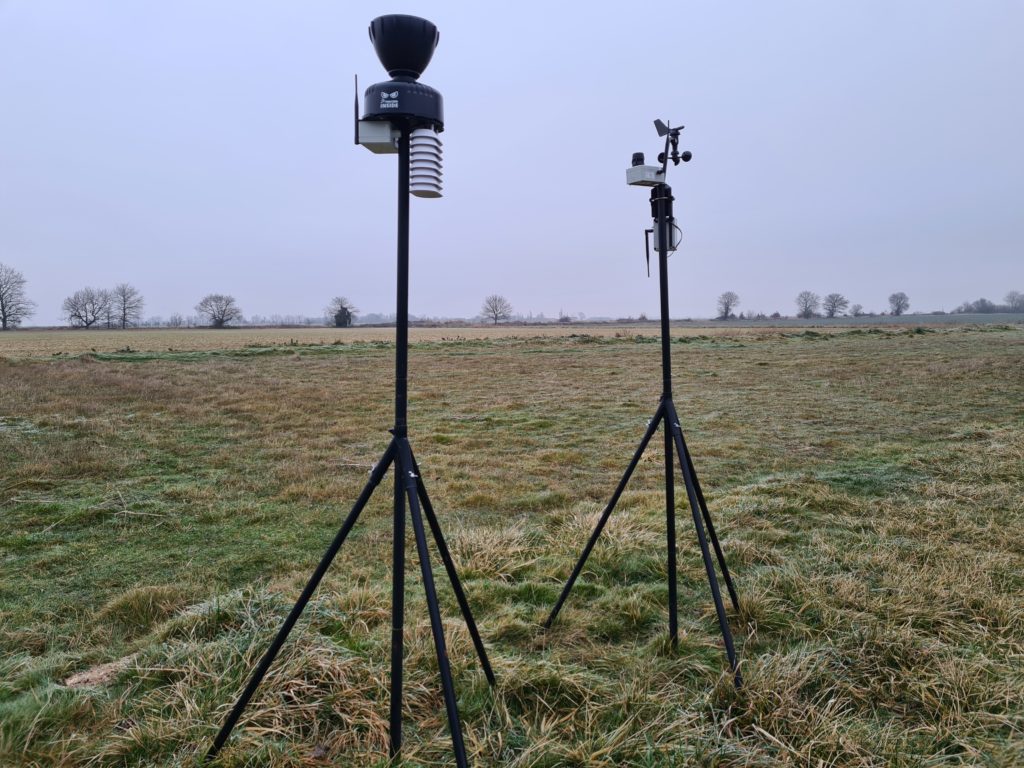
Two kinds of weather stations are available: One from national institutes like Meteo France and another one from personal weather stations like Sencrop for my case. The last ones allow to use very local data close to the crop fields.
The objective of this post is to compare an API from NASA to download spatialized calculated weather data (temperature) and data from Meteo France institute or from my local weather station.
Temperature will be studied first, as it is the most relevant data to run crop model and simulate crop growth to forecast phenological stages.
The final purpose of this work is to be able to donwload weather data on a daily frequence using geolocalized grids over a country like France and forecast crop growth stages on a country level.
MATERIALS AND METHODS
A R program was developped to test the NASA API, for selected weather stations (Figure 1) weather data from Meteo France are downloaded from different web sources (meteo60 and meteociel websites by data hand transcription for this resaerch purpose), the API is used to download temperature data for one year (2020-2021)
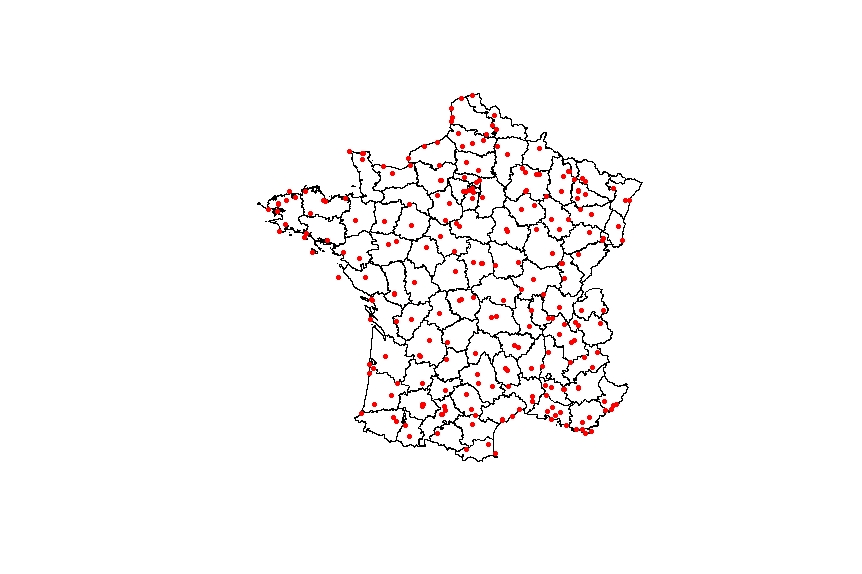
100 sites were selected in the comparison test, statistical analysis was processed between NASA calculated data and Meteo France Observed data.
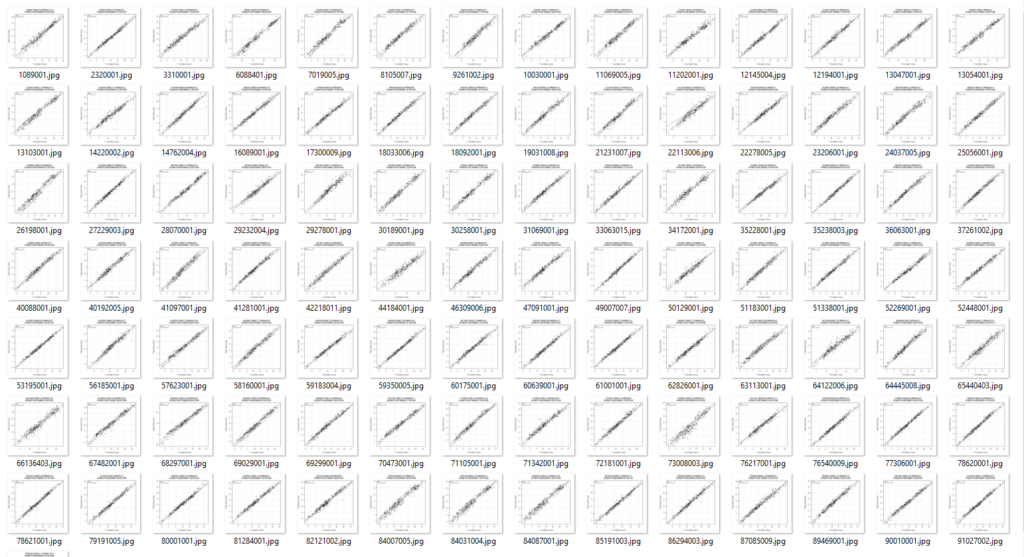
For each situation, linear regression results were stored in a database (Intercept, slope and R²) in order to determine the ability of the API to generate accurate data in the main crop production areas.
On a total of 190 stored weather stations, 100 Meteo France weather stations could be used because stored data were available.
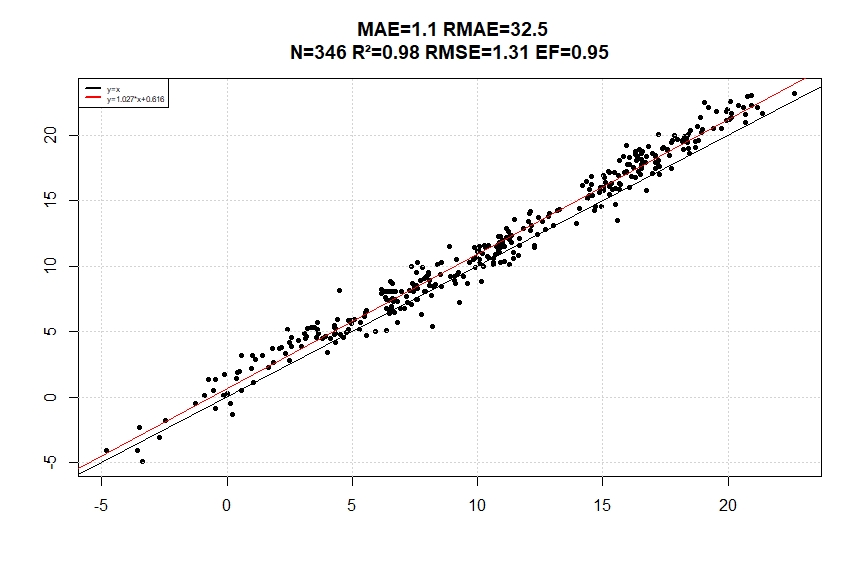
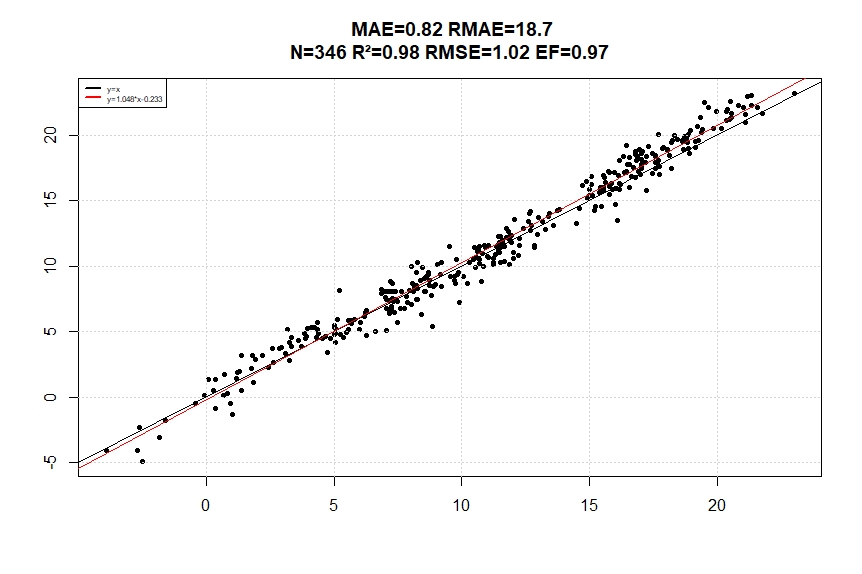
The linear regression is generated with MAE (Mean Absolute Error), RMAE (Root Mean Absolute Error), N (Number of days), R² (Squared correlation coefficient), RMSE (Roor Mean Square Error) and EF (Efficiency). The most important criterion is efficiency which as to be as close as possible to 1 (Intercept tend to 0 and slope tend to 1).
In a second step, the two weather sources will be used through the crop model to compare the growth stages occurences results.
| Mean absolute error | \(\mathrm{MAE}={\frac{1}{N}{\sum}_{i=1}^N{\left(|{P}_i-{O}_i\right|)}}\) |
| Root mean square error | \(\mathrm{RMSE}=\sqrt{\frac{1}{N}{\sum}_{i=1}^N{\left({P}_i-{O}_i\right)}^2}\) |
| Agreement index | \(\mathrm{d}=1-\frac{\sum {\left({O}_i-{P}_i\right)}^2}{\sum {\left(\left|{P}_i-\overline{O}\right|+\left|{O}_i-\overline{O}\right|\right)}^2}\) |
| Correlation coefficient | \(\mathrm{r}=\frac{\sum \left(P-\overline{P}\right)\left(O-\overline{O}\right)}{\sqrt{\sum {\left(P-\overline{P}\right)}^2}\sqrt{\sum {\left(O-\overline{O}\right)}^2}}\) |
| Where | O means Observed values and P Predicted values |
RESULTS
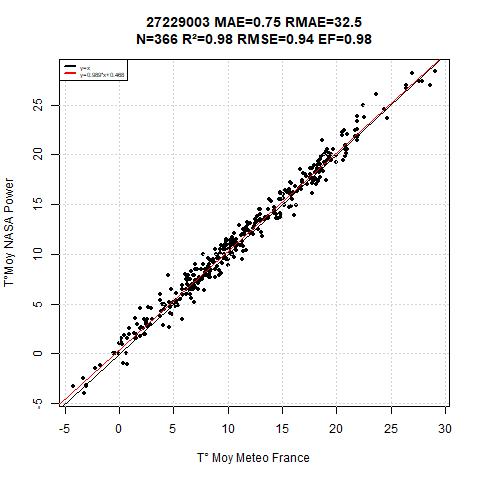
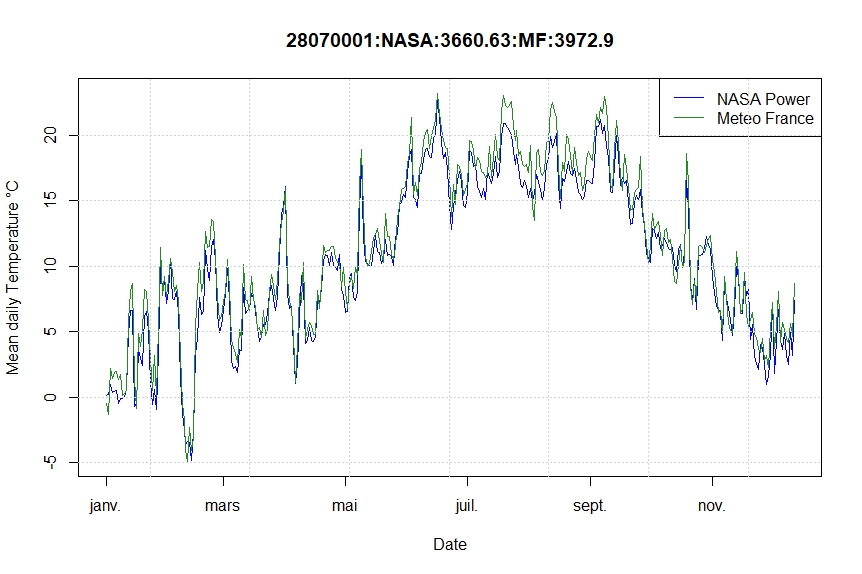
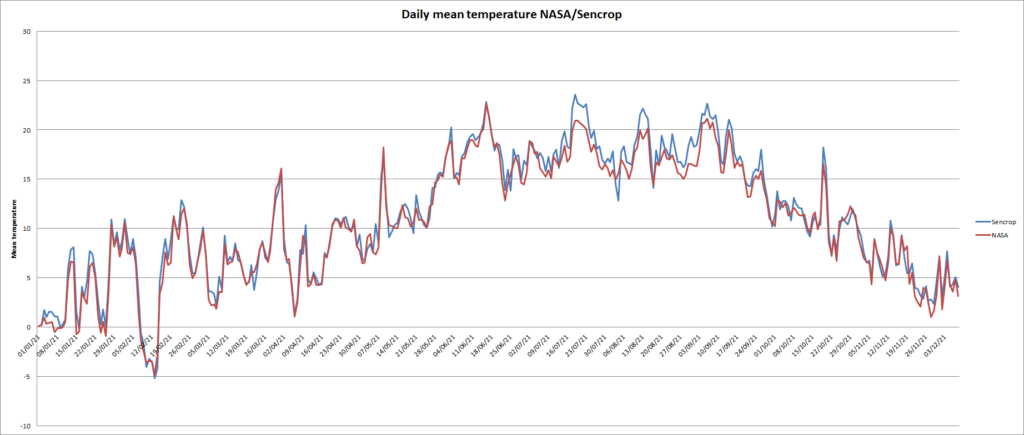
For this situation (figure 2), the mean temperature sum difference between NASA and Meteo France data was124 C° for 366 days ranging from 2020-06-23 to 2021-06-24.(Respectivelly 4100 vs 4224 Sum of daily temperature or a bias ratio of 2.9%)
This situation is the best results among all the tests.
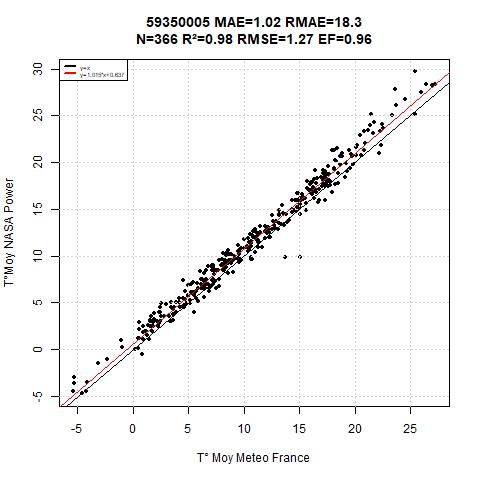
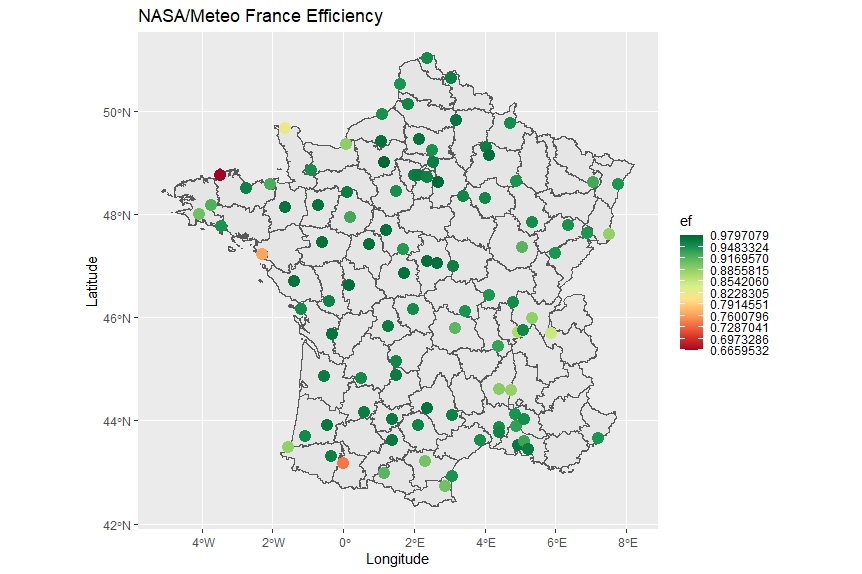
Figure 5 shows France result map indicating that the lower results are obtained aroud coasts.
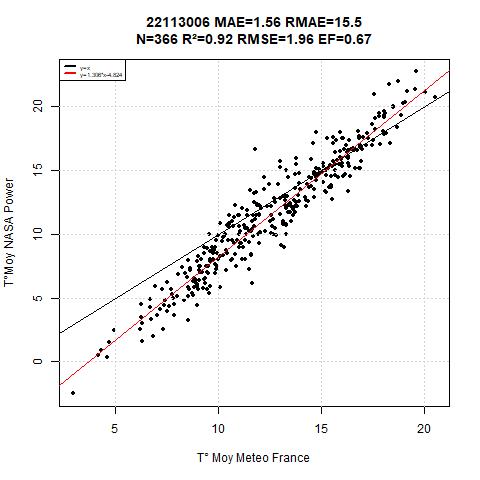
Figure 6 represent the badest results from the database, the intercept is -4.82 ans slope coefficient is 1.3, the R² (0.91) is not so bad, but clearly, there is a lack in the methodology, it would be important to use theses with care.
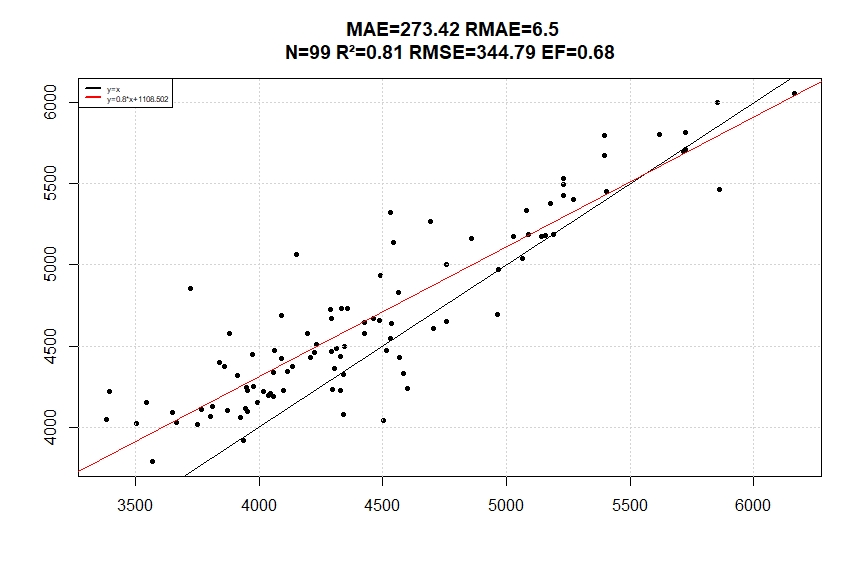
Below (Figure 7) the linear regression about the sum of mean temperature for the 99 sites on the 365 days in each run. Regression line indicate that a correction should be processed to the NASA downloaded data, the correlation coefficient is not the main objective but the y=x regression line is the objective, A slope coefficient different from unity will generate bias on a growing season usage instead of a lower R2 won’t because positive error would be compensated by negative errors.
STATISTICS RESULTS
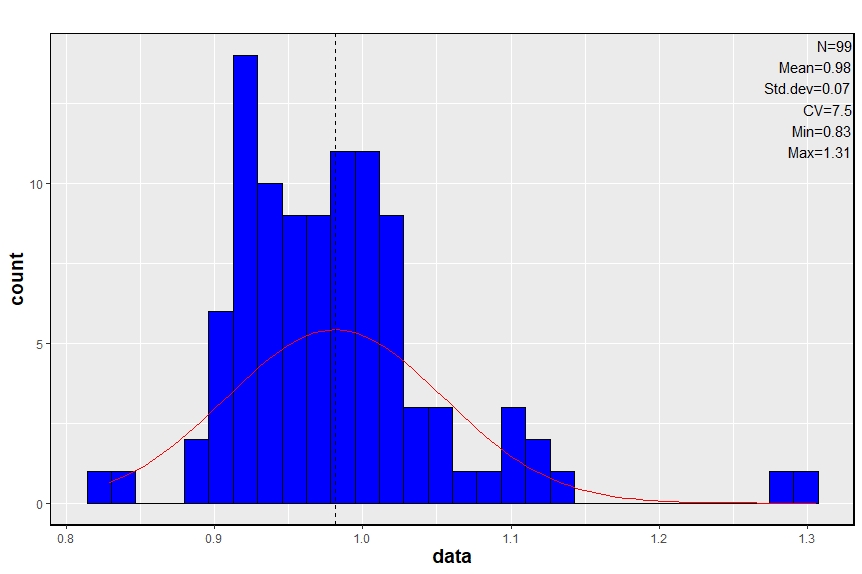
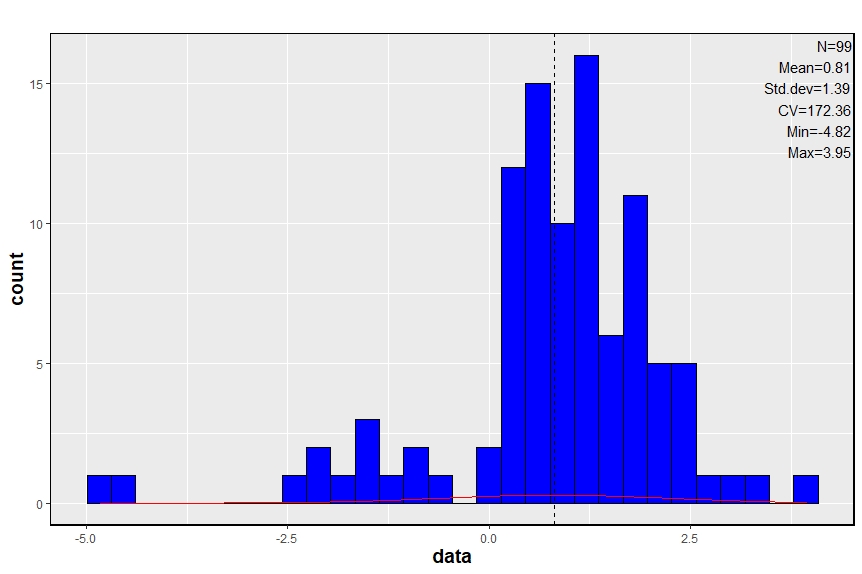
In order to use all the linear regression results to correct NASA data, a frequential analysis of slope and interception coefficient is processed. Mean values will be used to correct the data from France.
DISCUSSION
According to the statistc results it should be necessary to correct the calculated data by a linear regression with 0.98 value as slope coefficient and 0.81 as intercept coefficient.
Let’s look an example in Eure et Loir by comparing mean calculated temperature and observed (Meteo France) mean temperature (figure 11). There is a bias (8.5%
After correction by using the mean regression coefficients (a=0.98 b=0.81) the model generate following results:
After correction, interpolated data can be used in a crop model to simulate growth stages
Comparison with SENCROP data
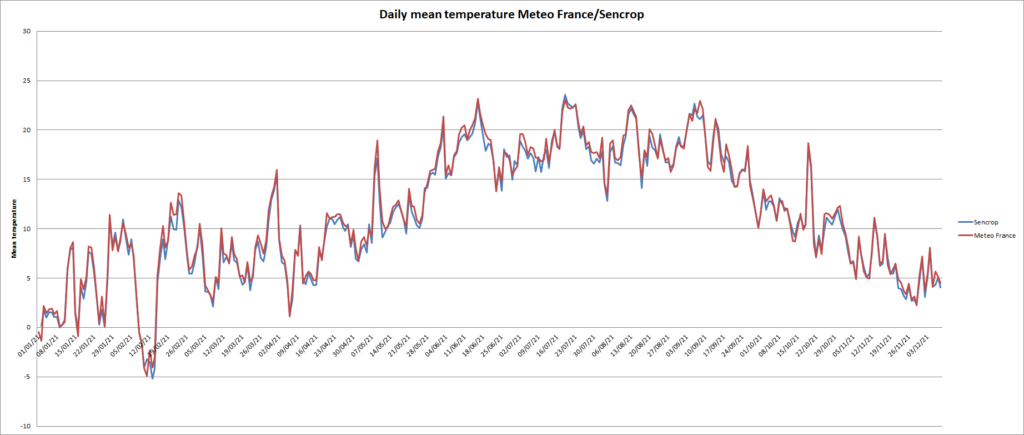
The graph (Figure 15) show mean temperature from Chartres (Meteo France) and Blandainville (Sencrop), distant from 25 kms and below (figure 16) the regression, on the 365 days there is a difference of 100 °C days for the mean sum temperature.
CONCLUSION
From these graphs, we can conclude that, spatialized weather data for temperature are interesting to run models over large areas, some times with coefficient correction.
About rainfall, results will probably not be the same, they are generally much more heterogeneous than temperature and solar radiation.
The next step will be a test about other meteorological parameters such as rainfall, wind, humidity and solar radiation.
Xavier Bailleau 2021/12