SATFARMING PRODUCT: SPATIAL FIELD CROP ANALYSIS
MATERIAL: Satellite images Sentinel 2 (ESA), vegetation index: NDVI
METHODOLOGY: Statistical analysis: Average, standard deviation, frequential analysis, raster clustering
OBJECTIVE: Highlight areas of interest in a field which need expertise
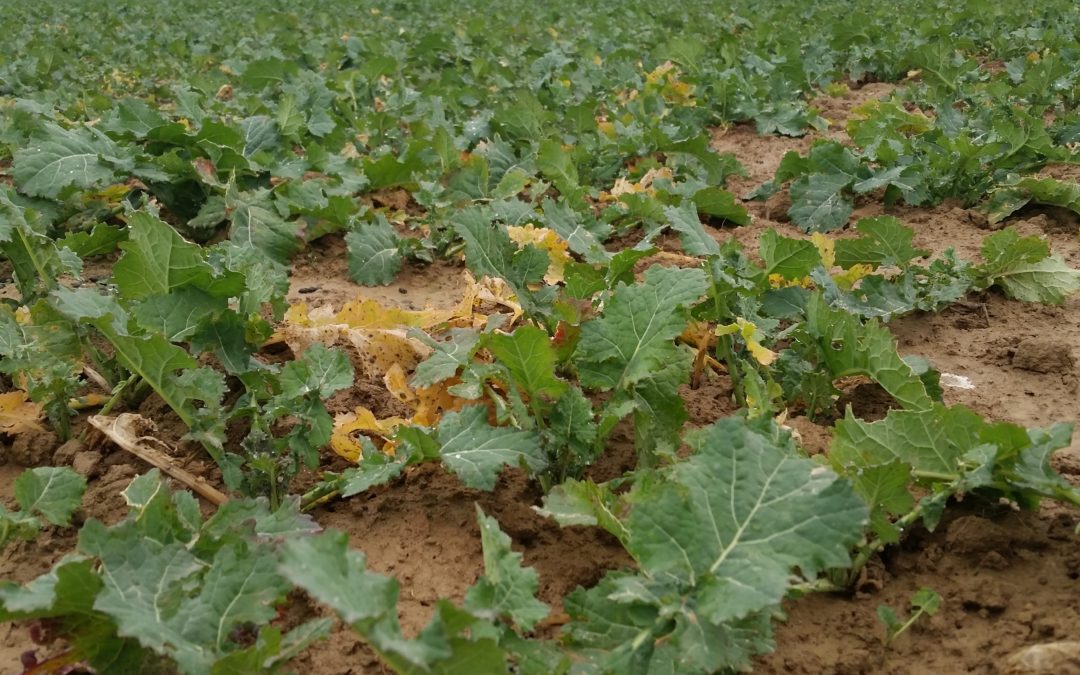
Watching crops is one of the main farmer’s tasks because he needs to know about the field crop status before deciding about what to do in it. Sentinel 2 is a regular crop watcher, function of cloud cover but it watches only top of atmosphere reflectance. These data are processed by Satfarming to provide usefull information. The main information is intra field spatial variability, the objective is to highlight vegetation areas where the farmer should investigate to explain some crop problems.
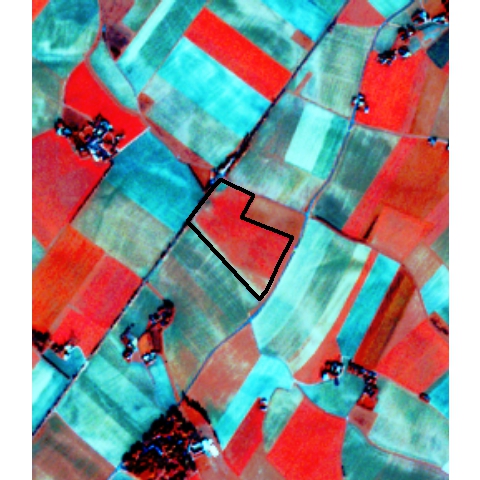
The above image show a RGB composite image replacing the red component by then near infra red band from Sentinel 2 taken on 2017/11/22, the field is delimited by the black line, crop is a rapeseed, these false color focus on vegetation because near infra red is very sensitive to biomass.
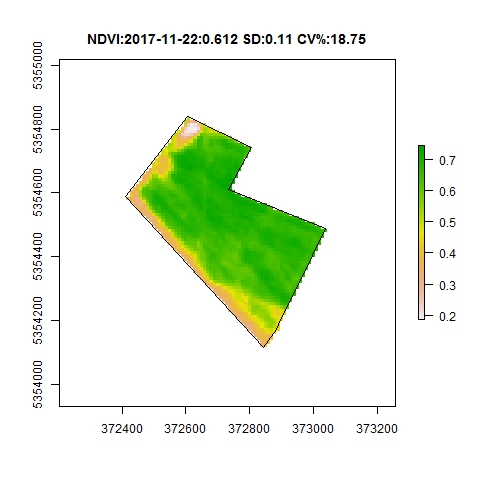
Above image: Rapeseed field (20ha) NDVI: Nutrient Vegetation Index from S2 (22/11/2017), on the title of the graph, field average, standard deviation(SD) and variation coefficient (CV) are indicated.
The lowest zone (Raster North west corner and upper left on the image below) is due to high soil clay and stone proportion, responsible of low emergence rate.
A raster is a two dimensions matrix, and a classical statistical analysis can be processed, the results are provided through a frequential analysis and cluster classification:
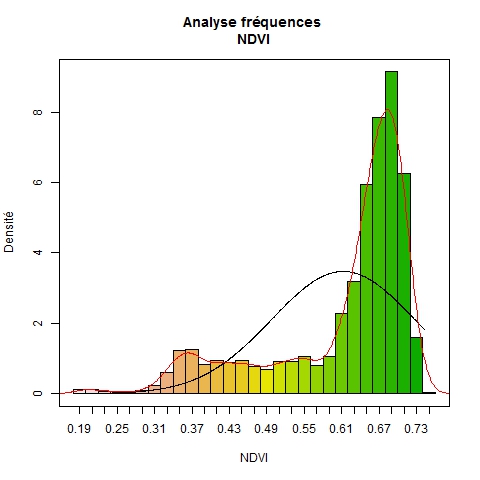
The black curve indicate the NDVI normal distribution considering the mean (0.612) and the standard deviation (0.11), the red curve indicate the smooth density plot.
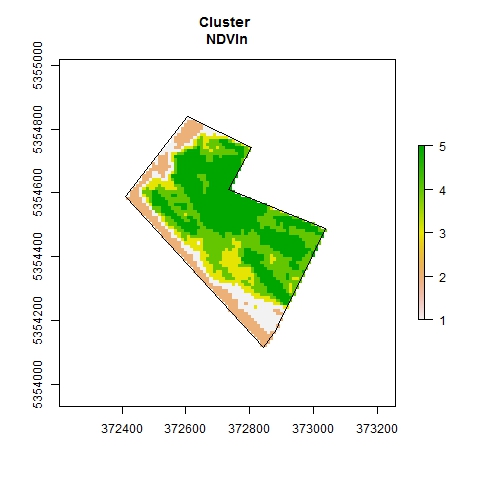 The cluster analysis separate the pixels in 5 classes from the lowest NDVI to the highest. This usefull to highlight the areas of interest (High vegetation or low vegetation)
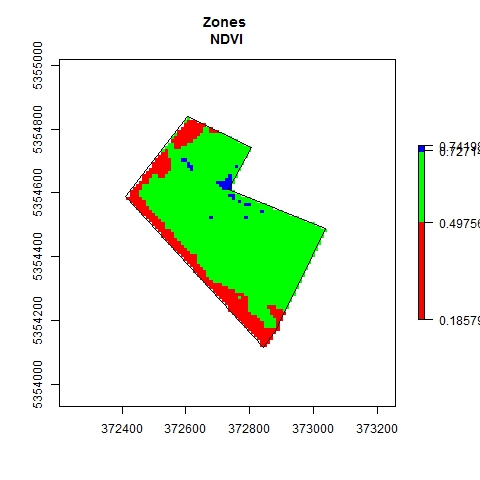 This map show only the extremes values areas (red:low level areas and blue:high level areas). On this example, red areas were sown just before 4 mm rainfall, resulting to a crust formation (Soil texture with 80% silt) and a very low level of emerged seeds.